Outdated documentation
You are reading outdated documentation. This page documents ChirpStack v3. ChirpStack v4 is the latest version.
Node-RED quickstart
Node-RED provides a browser-based flow editor that makes it easy to wire together flows using the wide range of nodes in the palette.
If you have installed the chirpstack-gateway-os-full image, then Node-RED comes pre-installed with ChirpStack Gateway OS since v3.5.0, including the node-red-contrib-chirpstack package which provides several nodes to interact with ChirpStack.
Enabling Node-RED
By default, Node-RED is disabled and must be enabled through the gateway-config utility. In the root menu, select Enable / disable applications and then Enable Node-RED. Note that once enabled, the option will change to Disable Node-RED. Starting Node-RED will take some time (~ one minute).
Access Node-RED
Once started, Node-RED is accessible in your browser on port http://[IP ADDRESS]:1880. This means that if the IP address of your gateway is 192.168.0.1, that you can access Node-RED at http://192.168.0.1:1880.
Building an echo flow
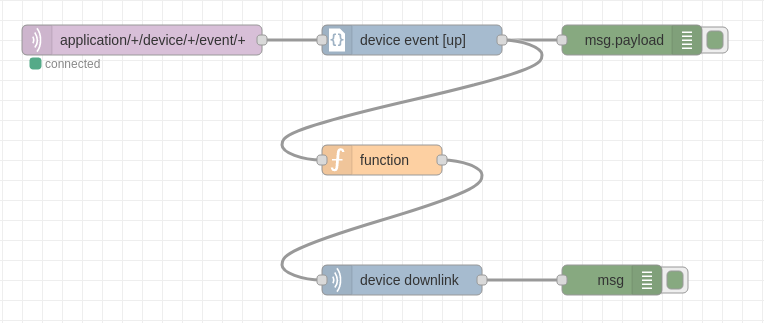
Below steps describe how to build an echo flow, which will enqueue the received uplink from the device as downlink. While this probably doesn't cover a real use-case, it does demonstrate how to receive uplink messages, process these and schedule downlinks.
It is assumed that you already have setup your gateway and device. It is also assumed that you have some basic knowledge about Node-RED.
Receive from MQTT
After opening Node-RED in your browser, first setup a mqtt in node. This node will be used to receive device events that are published by the MQTT broker that is running on the gateway (provided by the ChirpStack Gateway OS).
The following node properties must be set:
- Server:
- Server:
localhost - Port:
1883
- Server:
- Topic:
application/+/device/+/event/+ - QoS:
0 - Output: auto-detect
To test the connection to the MQTT broker, Deploy the flow. Under the newly added node you should see a label Connected.
Parse events
Now that you are able to receive events from MQTT, setup a device event node (you will find this node under the ChirpStack section). This node parses the payloads generated by the mqtt in node to objects and it will perform filtering based on event types.
The following node properties must be set:
- Event Type: Uplink
Connect the output side of the mqtt in node with the input side of the device event node.
Debug events
For debugging, add a debug node and connect it to the device event output and re-Deploy the flow. Open the debug messages tab in the Node-RED interface. When one of your devices sends an uplink, you should see the uplink event as debug message.
Echo payload function
To model the uplink event as downlink enqueue payload, add a function node and connect the input to the output of the device event node.
The following node properties must be set:
On Message
return {
    "payload": msg.payload.data,
    "fPort": msg.payload.fCnt,
    "confirmed": false,
    "devEUI": msg.payload.devEUI
};
This will make the function node output a message that can be used with the device downlink node, which will be added in the next step.
Enqueue downlink
Note: For this step you need to obtain an API token from the ChirpStack web-interface first!
To send the downlink message generated by the echo function to ChirpStack, add a device downlink node and connect the input to the output of the function node.
The following node properties must be set:
- Server:
localhost:8080 - API token: the API token obtained from the ChirpStack web-interface
- Payload Encoding: Base64
Enqueue output (debug)
To view the message generated by the device downlink node, add an other debug node and connect the input to the output of the device downlink node.
The following node properties must be set:
- Output: complete msg object
Testing the flow
Make sure to re-Deploy the flow, so that all changes are deployed. When sending an uplink frame, you should see two messages in the debug panel:
- The uplink event
- The response from the downlink enqueue
An example of the downlink enqueue output:
{"fCnt":1,"_msgid":"e3b9c3afa25e45f6"}
Note: it is possible that the device receives the downlink after the next uplink message.